6 March 2023 Valeria Giannelli
Journal of Experiences
Our research activity that investigates the stress associated with browsing a site or any other digital product with high cognitive barriers.
At TSW we are always looking for new research questions to answer, even better if they lead us to carry out research related to psychophysiological measurements. In this article we deepen our investigation activity regarding the cognitive load of a digital experience, conducted without interruptions and divisions by tasks, as generally happens in classic usability tests.
Companies often tend to underestimate the sum of usability barriers that people can encounter when navigating their sites. In most cases, in fact, unless there are serious barriers that prevent a certain function, companies do not tend to consider the site as problematic. But the presence of only low or medium barriers does not eliminate the possibility of a cognitive load indicative of stress.
In fact we can ask ourselves: what happens when these barriers accumulate? How does the experience go by the person who, while browsing the site, continues to encounter problems of a medium nature?
How we measured psychophysiological responses
To evaluate the cognitive load and the level of stress we went to measure the psychophysiological responses:
- Blinks: the number of blinks that a person makes during an activity is an indication of the cognitive load to which he is subjected. In particular, fewer blinks correspond to a higher cognitive load. These are recorded via eye-tracking, both through the bar and through the eye glasses.
- Skin conductance: the increase in emotional intensity in attentional processes reports an increase in cognitive load and consequently in stress.
What information do we get from the combination of the two indices
From the combination of these two indices we create a four-quadrant graph divided as follows:
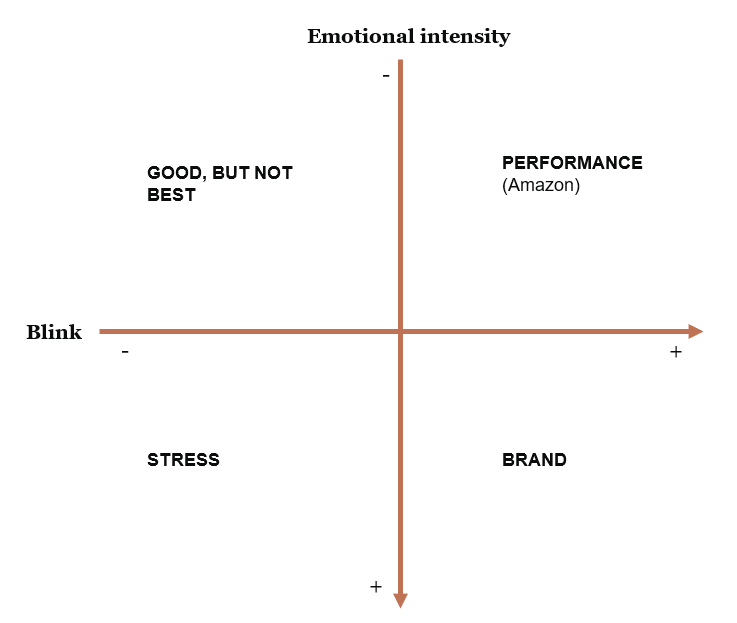
- Situation to avoid (bottom-left): this is the worst situation a site or experience could encounter. In this case, in fact, we have a situation of high cognitive load (few blinks) combined with a high level of emotional intensity (increased skin conductance). The combination of these two values would therefore lead to a stressful situation.
- Good, but not optimal situation (top-left): this quadrant shows high cognitive load values (low blinks), but without stress. It is therefore a slightly better situation than the previous one as it decreases stress, but as it maintains the same cognitive load. Potentially sites that are placed in this quadrant would lead the person to get tired much more quickly, thus decreasing the permanence on the site.
The two right-hand quadrants have different goals depending on emotional intensity:
- Focus «Performance» (top-right): we have a low cognitive load and little stress. This situation is ideal when you want to complete tasks as smoothly as possible. ES: Amazon. The application/site does not have an attractive layout (it does not engage), but you complete the purchase quickly.
- Focus «Brand» (bottom-right): with a high emotional intensity and little cognitive load we have a situation in which the goal is to generate an emotion towards the brand.
How we investigated cognitive and emotional load while browsing two websites
For this study we conducted a preliminary research by investigating two clothing sites with the aim of finding common tasks to be able to compare.
We involved 16 people and asked them to browse both clothing sites freely with the aim of buying 3 items. Leaving the person free to interact with the space/site/app allows us to evaluate the experience as close as possible to the real context. During navigation people wore skin conductance detector (SCL) and eye glasses.
The eye-tracking and conductance recordings started as soon as the person began free navigation on the first site, with the aim of completing the tasks alone. There were no time limits for sailing. At the end of the first experience, the researcher returned to the person and communicated the second site to be investigated. The viewing order of the sites was randomized among the participants.
Upon completion of the activity, we conducted an interview to understand opinions regarding the positive aspects or difficulties encountered: in short, all what we can call explicit opinions of the participants.
Results of research
We then dedicated ourselves to data analysis, dividing the experiences minute by minute with the aim of seeing the trend within the brand and between brands.
We noted that both experiences were placed in the upper left quadrant, i.e. that of “good, but not optimal”.
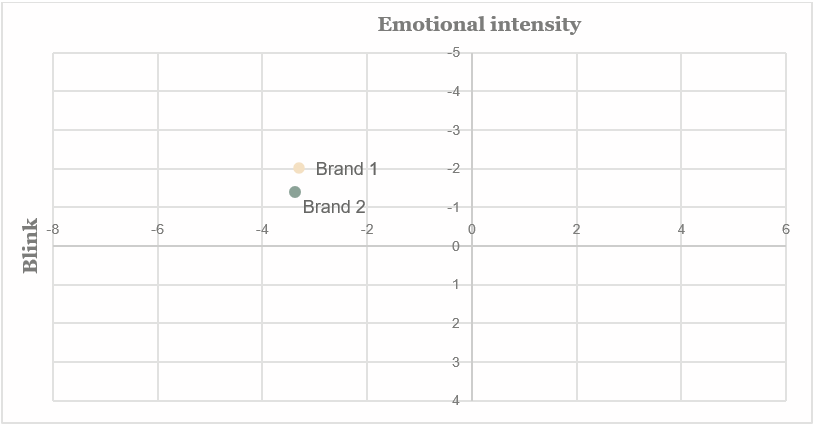
Both sites produced high cognitive load and low emotional intensity in the participants.
This data can then be analyzed in more depth by going to see the trend throughout its duration.
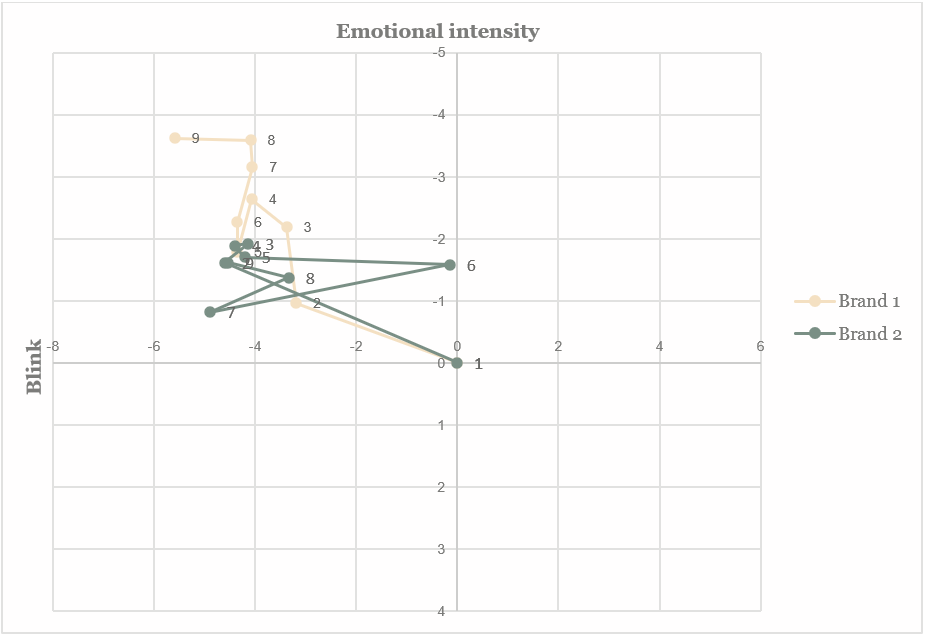
In this case we see how Brand 2 remains slightly stable in terms of cognitive load, while in the case of Brand 1, the cognitive load seems to increase over time (progressive decrease in blinks).
Implementations with other studios
Having considered only clothing sites in this study, we also wanted to analyze other types of experiences. We also analyzed an in-store test and a video test of a fashion show.
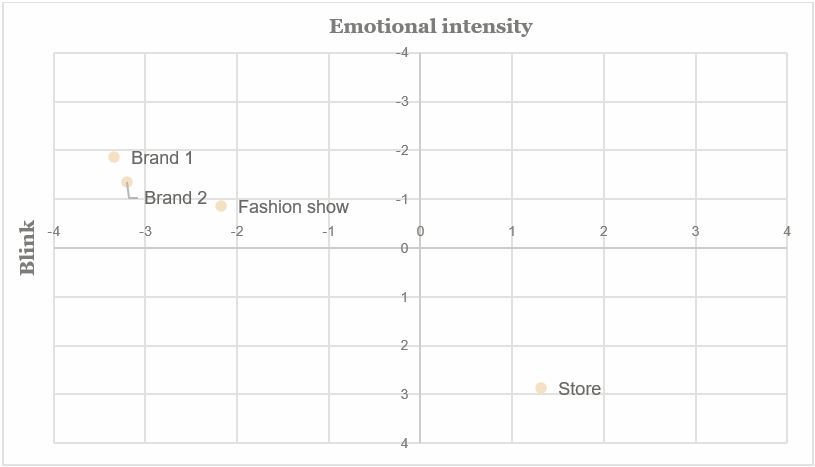
We can see how the in-store experience is placed in the quadrant with the focus on the «Brand», an optimal situation for the type of experience one would ideally want in a fashion store.
The video of the fashion show, on the other hand, is not placed in the ideal quadrant (that of the brand), but in the same quadrant of the two sites: the cognitive load is also slightly high in this case and no emotion is aroused.
What we learned from our research on cognitive load and emotional intensity
Combining these two psychophysiological data we can therefore objectively report the experience lived by the person in terms of cognitive load combined with stress.
Even if there were no high barriers, which prevented the participants from completing the tasks, the psychophysiological data and the interviews at the end of the experience reported that Brand 1 was more difficult to navigate than Brand 2, which in any case reports a suboptimal cognitive load.
Leaving people free to live an unmoderated experience and to browse the sites at will, while we detect these two parameters, allows us to demonstrate the concept of fluidity of experience and what impact medium-sized barriers can have on it.